Relationship between XRP Price and Whale Flows (In Millions) Over Time
3 min read
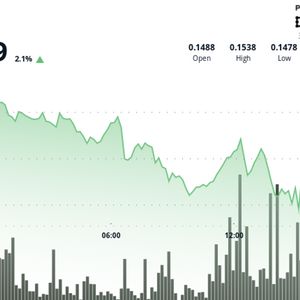
A recent post by crypto expert Jungle Inc (@jungleincxrp) highlights a revealing pattern in XRP’s price movements relative to whale flows. The chart he shared showcases how the behavior of whales has consistently aligned with significant price shifts over the past year. Whale Accumulation Precedes Major Rally The data begins in August 2024, a period where whale flows were deeply negative, hovering around -150 million XRP. During this time, the XRP price remained suppressed near the $0.5 level. By September and October 2024, the whale flow trajectory shifted sharply upward. This transition from negative to positive flows continued into November and December , eventually reaching a peak inflow of approximately +250 million XRP. Correspondingly, XRP’s price surged dramatically, climbing from around $0.5 to just over $3 by the end of 2024. This chart shows the relationship between whale flows (in millions) and XRP price over time. From Aug–Dec 2024, whale flows shift from strongly negative to positive (+250M), coinciding with a steep XRP price rally from ~$0.50 to ~$3.00 — suggesting whales accumulate before price… pic.twitter.com/9uFpt7oKd1 — Jungle Inc Crypto News (@jungleincxrp) June 28, 2025 Distribution Phase Leads to Price Decline Following the December 2024 activity peak, the pattern shifted once again. Between January and April 2025, whale flows declined steeply, moving from their +250 million peak to negative territory. There was speculation in December that whales were preparing for a massive move in January , and XRP hit its multi-year high of $3.39 that month. The drop in whale flows coincided with the price topping out, a signal that whales were likely distributing their holdings while broader retail interest remained elevated. As the wheels began shifting, XRP’s price responded accordingly, retreating from its high level in early February and spending the following months consolidating between $2 and $2.5. We are on X, follow us to connect with us :- @TimesTabloid1 — TimesTabloid (@TimesTabloid1) June 15, 2025 This distribution phase was particularly notable in February and March 2025. Whale flows dipped to their lowest post-peak levels, suggesting sustained selling pressure from large holders. Meanwhile, the price experienced a persistent decline, though it remained well above pre-rally levels. Renewed Accumulation Signals Possible Repeat By May and June 2025, the chart reveals another pivotal shift. Whale flows turned sharply positive again, climbing back to +300 million XRP. This occurred while the price found stability around the $2 mark. Jungle Inc pointed out that this is structurally similar to the accumulation phase observed in late 2024, hinting at the potential for a repeat of the previous rally pattern if conditions align. XRP is currently experiencing record-breaking whale activity , and the consistent correlation between whale flows and price movements suggests that this growing accumulation will give way to a massive breakout. Disclaimer : This content is meant to inform and should not be considered financial advice. The views expressed in this article may include the author’s personal opinions and do not represent Times Tabloid’s opinion. Readers are advised to conduct thorough research before making any investment decisions. Any action taken by the reader is strictly at their own risk. Times Tabloid is not responsible for any financial losses. Follow us on X , Facebook , Telegram , and Google News The post Relationship between XRP Price and Whale Flows (In Millions) Over Time appeared first on Times Tabloid .

Source: TimesTabloid