Bitcoin Move to $96K or $106K Next? (BTC Price Analysis)
3 min read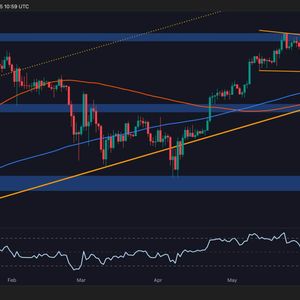
Bitcoin just broke below a multi-week consolidation range as things get even more heated in the Middle East. While the long-term trend remains bullish, short- to mid-term momentum is weakening as the market shows signs of lower highs and lower lows forming. By Shayan Bitcoin Price Analysis: Technicals The Daily Chart The daily timeframe paints a more concerning picture for buyers. BTC was stuck in a tightening range for several weeks, forming a descending triangle. This structure broke to the downside briefly with a wick, as the price aggressively tested the demand zone between $98K and $100K. This are had previously acted as a launchpad for the May rally. The reaction here has been sharp: BTC printed a long lower wick, indicating the presence of aggressive buyers. While follow-through remains limited, the daily candle closed back inside the pattern, suggesting that this behavior might just be a sell-side liquidity sweep. Moreover, the RSI on the daily has now dropped to the 40 level, hovering just above the oversold threshold. This isn’t yet bullish divergence, but it does show that momentum is no longer in the buyers’ favor. If the $98K–$100K zone fails to hold on a closing basis, BTC could quickly drop toward the next major support around 96K, which also aligns with the 100-day and 200-day moving averages, and the lower boundary of the large ascending channel. Source: TradingView The 4-Hour Chart Zooming into the 4H timeframe, we can clearly see the breakdown structure and how BTC has been respecting bearish order flows. After the sell-side liquidity grab just below $100K, the price bounced sharply and filled the FVG that formed between 100K and $102K. This fair value gap is now acting as resistance, capping any bullish attempts to push higher. There are two FVGs now in play: the recent one just above 100K and the older one near $106K, which previously pushed the price lower. Unless BTC reclaims the recent high near the $103K mark with conviction, it’s more likely to revisit lower support levels than to retest the $106K area. Notably, the 4H RSI has bounced from oversold conditions (near 30) to the 40–45 range, indicating a short-term relief, but this is still far from a trend reversal. Market structure remains bearish with lower highs and lower lows being printed consistently since mid-June. In short, the 4H bias remains bearish below $103K, and price is currently trading inside a reaction zone. Bitcoin needs to break and close above this FVG for any potential reversal to gain momentum. Source: TradingView On-Chain Analysis Bitcoin Miners Position Index The onchain landscape provides a bit of relief for long-term holders. The latest reading of the Miners’ Position Index (MPI) shows that miner selling pressure is minimal. Historically, elevated MPI values (above 2) have preceded strong market corrections, as miners tend to offload large amounts of BTC into rallies. However, current MPI values remain well below 1, signaling that miners are holding their coins rather than selling them aggressively. This suggests that the recent drop is more likely driven by market structure, liquidity grabs, and short-term derivatives pressure, rather than long-term fundamental shifts. Combined with stable exchange reserves and growing accumulation wallets, the data leans neutral to slightly bullish from an onchain perspective. Source: CryptoQuant The post Bitcoin Move to $96K or $106K Next? (BTC Price Analysis) appeared first on CryptoPotato .

Source: Crypto Potato