Ethereum (ETH), Ripple (XRP), and Solana (SOL) tumble: Price Analysis
2 min read
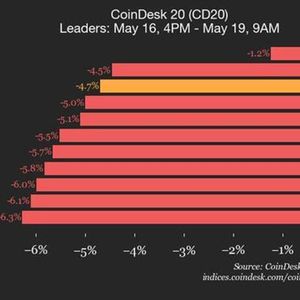
With the US debt being downgraded by Moody’s credit rating agency on Friday the top crypto layer 1 blockchain tokens have fallen in value. Was this just a correctional sell-off for $ETH, $XRP, and $SOL, or is this the beginning of a deeper reversal? $ETH short-term lower highs and lows Source: TradingView The short-term chart for $ETH shows that the price has been making a series of lower highs and lower lows since reaching a local top at $2,737. The last lower low confirmed the major $2,500 level as resistance again, which is an unfortunate turn of events for the bulls. From a more positive aspect, the descending trendline is still holding, and the price is battling to maintain the $2,400 support. The Stochastic RSI is not far off the bottom, so this could provide the momentum to reach the $2,500 resistance level again. Flag forming for $ETH on daily chart Source: TradingView The daily chart displays the descent of the $ETH price since November of 2024, with the recent explosion up through the descending trendline. It appears as though a flag may be forming for the price. If the break is to the upside, the sharp uptrend can continue, but a break to the downside might spark a retreat to $2,000. $XRP finds strong support Source: TradingView The $XRP daily chart shows the price is currently back underneath the descending trendline. That said, it has touched the 0.618 Fibonacci level, and so a bounce may take place from here. The $2.30 horizontal level is a major support as well. As long as there isn’t a major meltdown when the US stock exchange opens later on Monday, the $XRP price might be expected to head back up and for the bulls to attempt another higher high. A lower low below $2.08 would on the other hand be a cause for concern. So far so good for $SOL despite 7% drop on Monday morning Source: TradingView In spite of losing more than 7% in value so far on Monday, it could even be said “so far so good” for the $SOL price . The spike downwards today has been held by the ascending trendline. $161 is also a good horizontal support level. Of course, if these supports don’t hold and the price takes hold below, there could be a much deeper correction to come. As it stands, and US stock market allowing, a strong bounce back to the $184 resistance level could take place later in the week as short-term Stochastic RSIs, as far up as the daily, start to turn back to the upside. Disclaimer: This article is provided for informational purposes only. It is not offered or intended to be used as legal, tax, investment, financial, or other advice.

Source: Crypto Daily